Table Builder
Organize anything with our powerful online table maker. Turn messy spreadsheets into collaborative databases with views, filters, and automations.
Grid View Kanban Calendar
🔍 Search ⚡ Filter Share

Organize anything with our powerful online table maker. Turn messy spreadsheets into collaborative databases with views, filters, and automations.
Move beyond basic spreadsheets.
Upload a CSV, Excel file, or sync from Google Sheets to get started instantly.
Define column types (Status, Date, User), add formulas, and set up data validation.
Sort, filter, and group records. Switch views to visualize data as cards or a calendar.
Share with your team, assign tasks, comment on rows, and export reports.
Everything you need to manage data, projects, and processes.
Go beyond text and numbers. Use status dropdowns, file attachments, ratings, and checkboxes. Create powerful formulas to calculate values automatically.

See your data the way you want. Toggle instantly between the master Grid view, a Kanban board for workflow, a Calendar for dates, or a Gallery for visual assets.

Work together without stepping on toes. @Mention teammates in comments, see who is viewing the table, and manage permissions with granular roles.
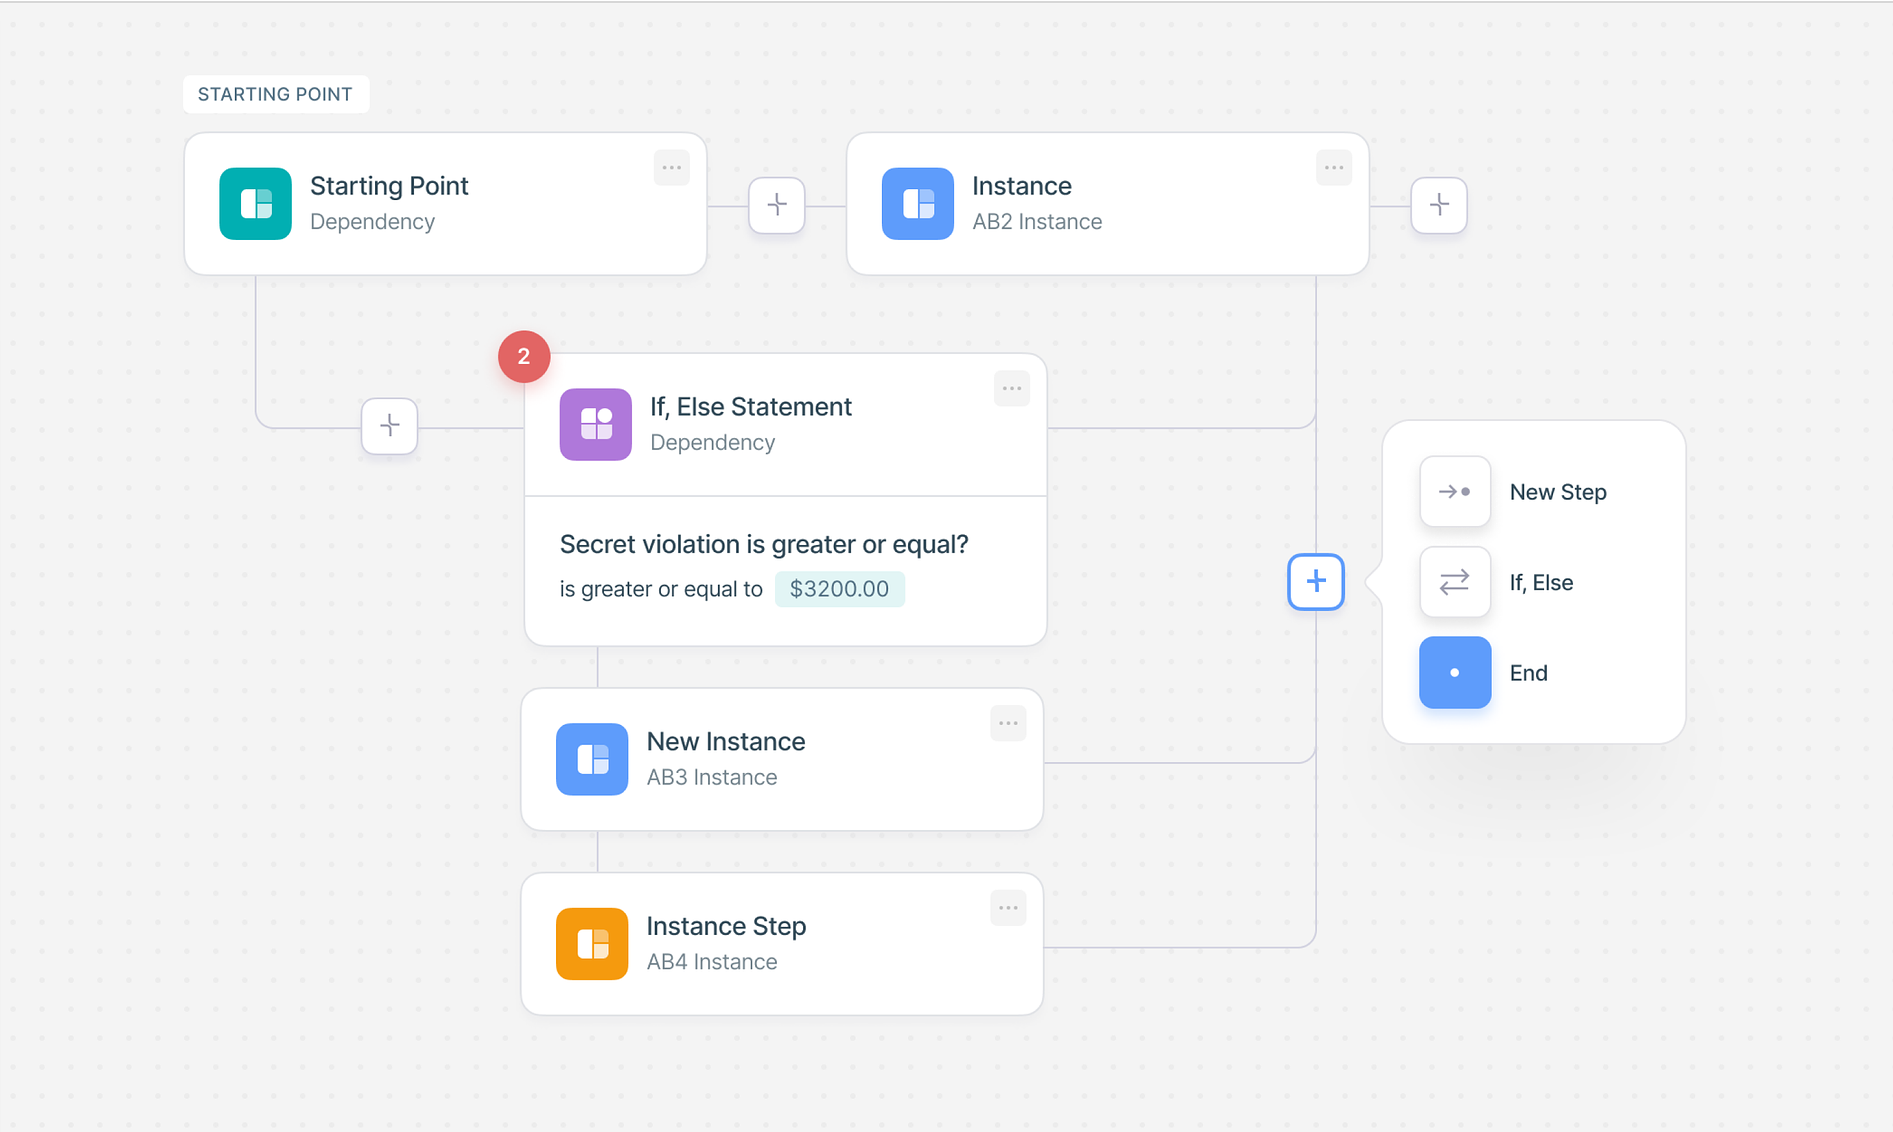
Let the table work for you. Set up automated email reminders when dates approach. Visualize your data with built-in summary charts and dashboards.
Pre-built structures for common use cases.
Track leads, deals, and contacts in a flexible sales pipeline.
Plan blog posts, social media, and campaigns with a calendar view.
Manage stock levels, suppliers, and orders with product images.
Log bugs, assign tasks to developers, and track resolution status.
Oversee tasks, deadlines, and team workload in one place.
Log hours, calculate billable time, and manage approvals.
Sync your tables with the rest of your tech stack.
Start for free, scale as you grow.
$ 15 /month/user
Billed monthly
Ideal for freelancers, startups, and smaller teams
We only bill you for employees. Invite guests/clients for free.
$ 299 /month
Billed monthly
Top-of-the-line, all-inclusive fixed pricing. Best fit for fast growing businesses
Your whole organization for one fixed price. Every feature & upgrade.
Custom
Billed monthly
Suitable for Enterprise solutions
Custom pricing for your organization's needs.
Frequently asked questions
Supatool is widely considered one of the best apps to create tables because it combines the simplicity of a spreadsheet with the power of a database. You can build tables, link records, add attachments, and visualize data in multiple views (Grid, Kanban, Calendar) without writing code.
A TableBuilder is a tool that allows you to construct data tables visually. It lets you define columns (text, number, date, select), import data, and organize information into a structured format that is easy to search, filter, and share.
Yes, advanced tools like Supatool leverage AI to help you build tables. You can describe the data you want to track (e.g., 'a project tracker for a marketing team'), and the AI can generate the table structure, columns, and even sample data for you.
The best place to create a table depends on your needs. For simple, collaborative data management with rich features like file attachments and status tracking, an online platform like Supatool is ideal. For pure number crunching, Excel or Google Sheets might be preferred.
You can create robust tables for free on Supatool. Our free plan allows you to build multiple tables, import data, and collaborate with your team, giving you a powerful alternative to basic spreadsheet tools.
Yes, Supatool is mobile-responsive. You can access your workspace via your iPhone's browser to view, edit, and add rows to your tables on the go. There are also native apps for other table tools like Google Sheets or Airtable.
Google offers 'Google Tables' (beta/Area 120) and, more commonly, Google Sheets. While Sheets is a spreadsheet, Supatool offers a more structured 'database-like' table experience similar to Google Tables but with more customization and integration options.
Yes, you can insert basic static tables in Microsoft Word for documents. However, for dynamic data management where you need to filter, sort, calculating formulas, and collaborate in real-time, a dedicated online table builder like Supatool is much more effective.
Canva allows you to add visual tables to your designs for presentations or infographics. These are great for display but lack the database functionality (sorting, filtering, formulas) of a true data management tool like Supatool.
You can create table charts in Supatool. Once your data is in a table, you can easily generate summary charts (bar, pie, line) directly from that data to visualize trends and metrics on a dashboard.
The preferred method today is using a no-code online table builder. This approach separates data structure from presentation, allowing for better data integrity, collaboration, and the ability to view the same data in different ways (like a calendar or Kanban board) compared to traditional static spreadsheets.
Ready to organize your data?