Free Online Report Maker
Design engaging reports, proposals, and presentations. Use our free report maker to visualize data and collaborate with your team.
Design engaging reports, proposals, and presentations. Use our free report maker to visualize data and collaborate with your team.
Turn your data into professional stories in minutes.
Start fast by selecting from our gallery of professionally designed report templates. Whether you need a marketing report, financial summary, or project update, we have you covered.
Don't waste time manual entry. Connect your Google Sheets, upload a CSV, or integrate directly with your databases to populate charts automatically.
Drag and drop charts, tables, and images. Apply your brand kit with one click to ensure your logo, fonts, and colors are consistent throughout the report.
Download your report as a high-quality PDF, PNG, or interactive web link. Share it with stakeholders securely via email or embed it on your intranet.
Powerful tools to create stunning reports without the hassle.
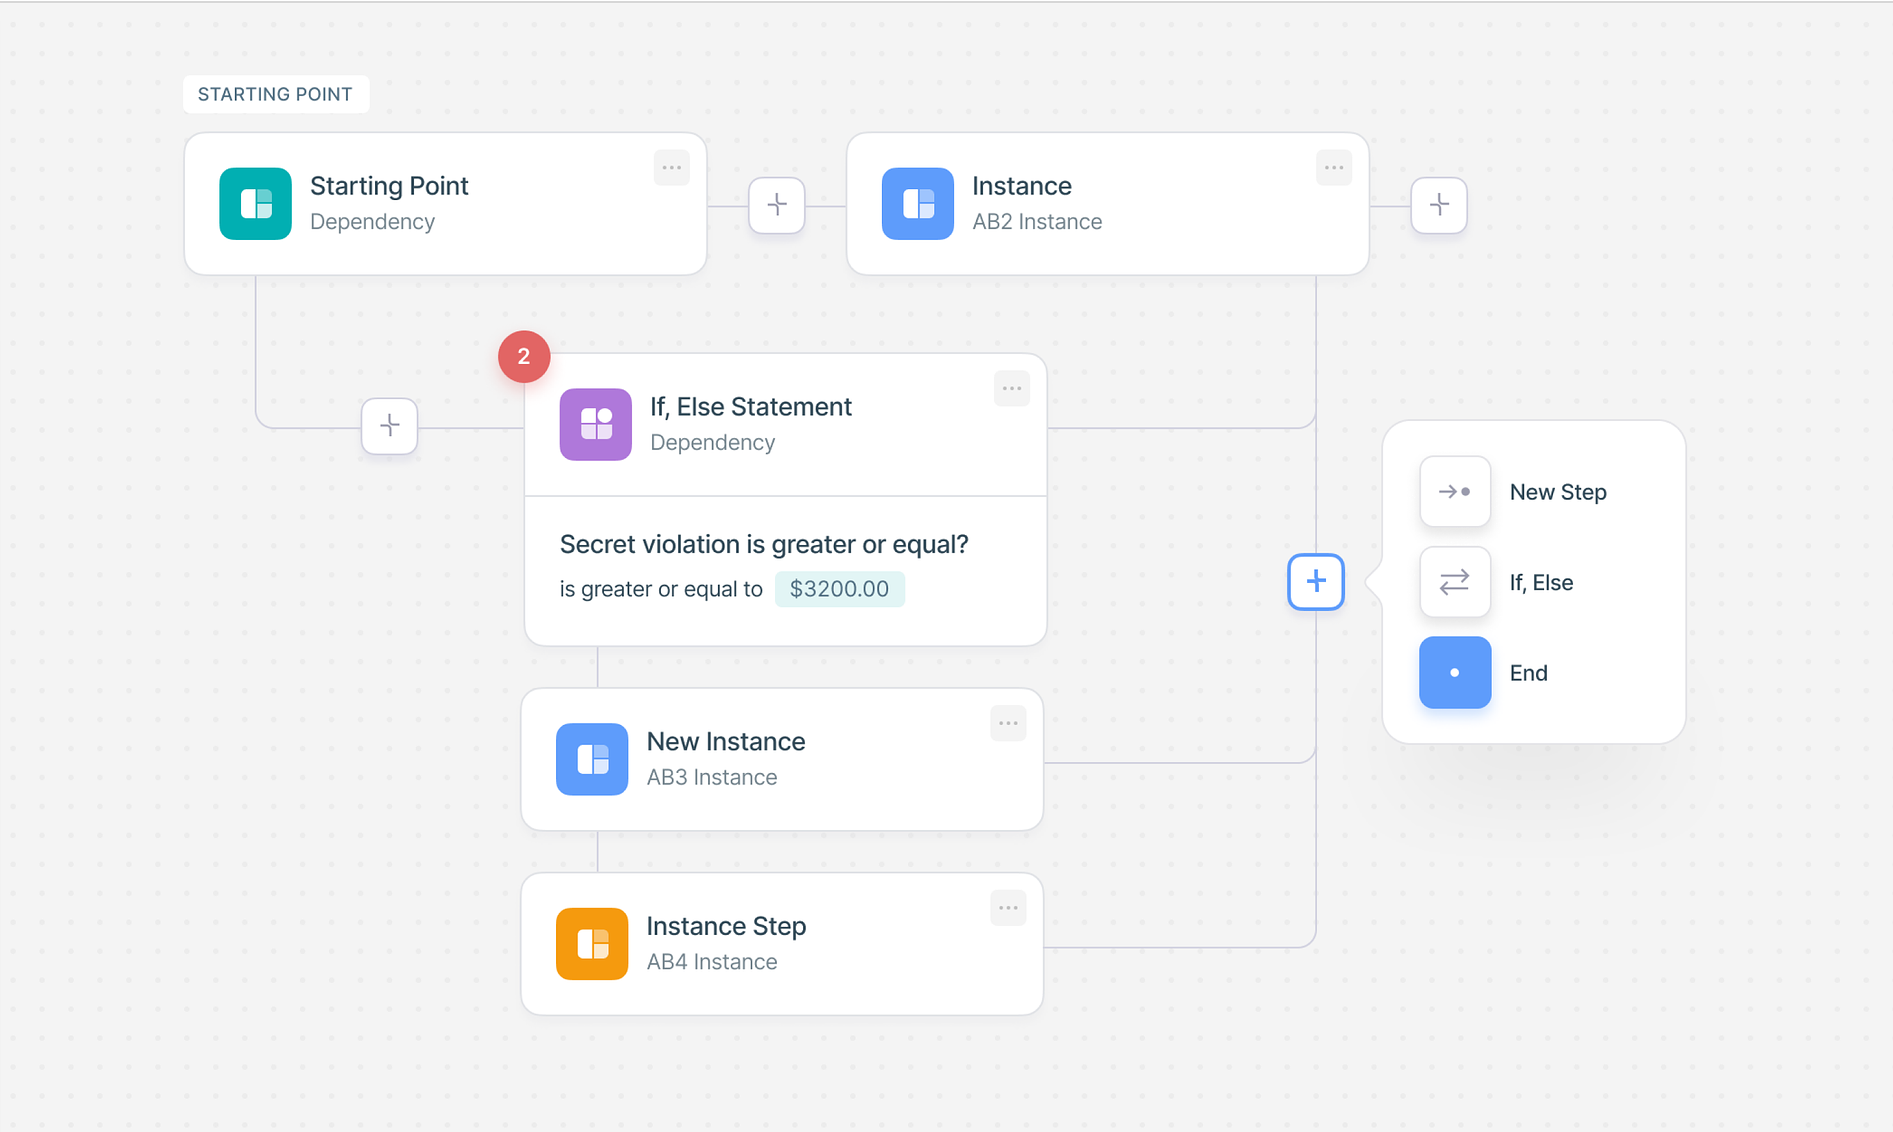
Design freely. Move text blocks, resize images, and arrange data widgets exactly where you want them. No coding or complex design software required.

Bring your numbers to life. Import data directly from CSVs or Google Sheets and instantly generate bar charts, line graphs, pies, and maps.
Stay on brand, always. Define your brand colors, fonts, and logos once, and apply them to any template with a single click. Choose from hundreds of professional layouts.

Work together in real-time. Invite team members to edit or comment. Share your final report via a secure link, embed it on your site, or download as PDF/PPTX.

Find the perfect starting point for your next report.
Connect your reports to the data sources that matter most.
Start for free, upgrade for power features.
$ 15 /month/user
Billed monthly
Ideal for freelancers, startups, and smaller teams
We only bill you for employees. Invite guests/clients for free.
$ 299 /month
Billed monthly
Top-of-the-line, all-inclusive fixed pricing. Best fit for fast growing businesses
Your whole organization for one fixed price. Every feature & upgrade.
Custom
Billed monthly
Suitable for Enterprise solutions
Custom pricing for your organization's needs.
Frequently asked questions
An online report maker is a web-based tool that allows you to create, design, and share professional reports without needing expensive software or graphic design skills. It typically offers drag-and-drop functionality, pre-built templates, and data visualization tools to transform raw data into engaging documents.
To write an effective online report, start by defining your objective and audience. Use a clear structure with headings, an executive summary, and data-backed findings. With Supatool, you can choose a relevant template, input your text, and visualize your data with charts to make your report easy to read and persuasive.
Supatool is a top-rated app for making reports online. It combines the ease of a drag-and-drop editor with powerful data integration and visualization features, making it suitable for everything from business proposals to academic project reports.
Creating a report is simple with Supatool: 1) Sign up and select a report template. 2) Import your data from CSV, Google Sheets, or enter it manually. 3) Customize the design with your brand colors and fonts. 4) Add charts, graphs, and images. 5) Export as PDF or share via a link.
For a balance of professional features and ease of use, Supatool.io is an excellent website for report writing. It offers a free tier, a wide range of business and creative templates, and collaborative features that allow teams to work on reports together in real-time.
A standard report writing format usually includes: Title Page, Table of Contents, Executive Summary, Introduction, Body (Methodology, Results, Discussion), Conclusions, Recommendations, and Appendices. Supatool's templates are pre-structured with these sections to ensure your report follows professional standards.
You can report virtually anything online, including sales performance, marketing analytics, project status updates, financial audits, survey results, and market research. Online reporting ensures data is accessible, up-to-date, and interactive for stakeholders.
Ready to create your report?